

Getting started
Your first day
Your cost data lands overnight, then a person opens the dashboards. Three checks are worth running the moment they do.
Once you confirm the connection, a progress screen names the ingestion window and the day your first cost data is expected.
The run is a timer. Opening the dashboards is a person. Infralign checks that first run, and once it has landed your dashboards open within one business day. A person at support@infralign.ai emails you when they are live.
What the visibility tier includes is on the free offer.
Infralign collects cost for the subscriptions you scoped and no others. A subscription created later is never added on its own. An admin adds it on the connection page. See adding a subscription later.
The first nightly run
Section titled “The first nightly run”The next nightly run reads through the service principal and builds your warehouse:
| Time (UTC) | Stage | What happens |
|---|---|---|
| 02:30 | Acquire | Infralign reads cost, inventory, Advisor, Monitor, Activity Log, and retail price data. |
| 03:45 | Derive | Raw data is shaped through the first warehouse layers (bronze → silver). |
| 04:45 | Build | The shaped data is built into the gold layer and the marts the dashboards read. |
| 05:45 | Sync | The dashboards refresh against the new data. |
| 06:15 | Ready | The night’s data is in place and the dashboards are serving it. |
The timers run on UTC. Read the table against your own clock: at Irish or UK summer time the window is 03:30 to 07:15, and in central Europe it is 04:30 to 08:15.
That last row is the steady state, from your second run onwards. On the first run it means only that the data has landed, and your dashboards then open within one business day.
The first run backfills cost history, so the dashboards open with a trend already in them.
Estates whose daily Cost Details export outgrows the nightly window can add the optional FOCUS export lane.
What to look at first
Section titled “What to look at first”Check the billed total
Section titled “Check the billed total”- Open the Executive dashboard.
- Select the latest complete month.
- Compare Billed cost with your Azure invoice.
Done when the dashboard shows a billed total for every connected subscription.
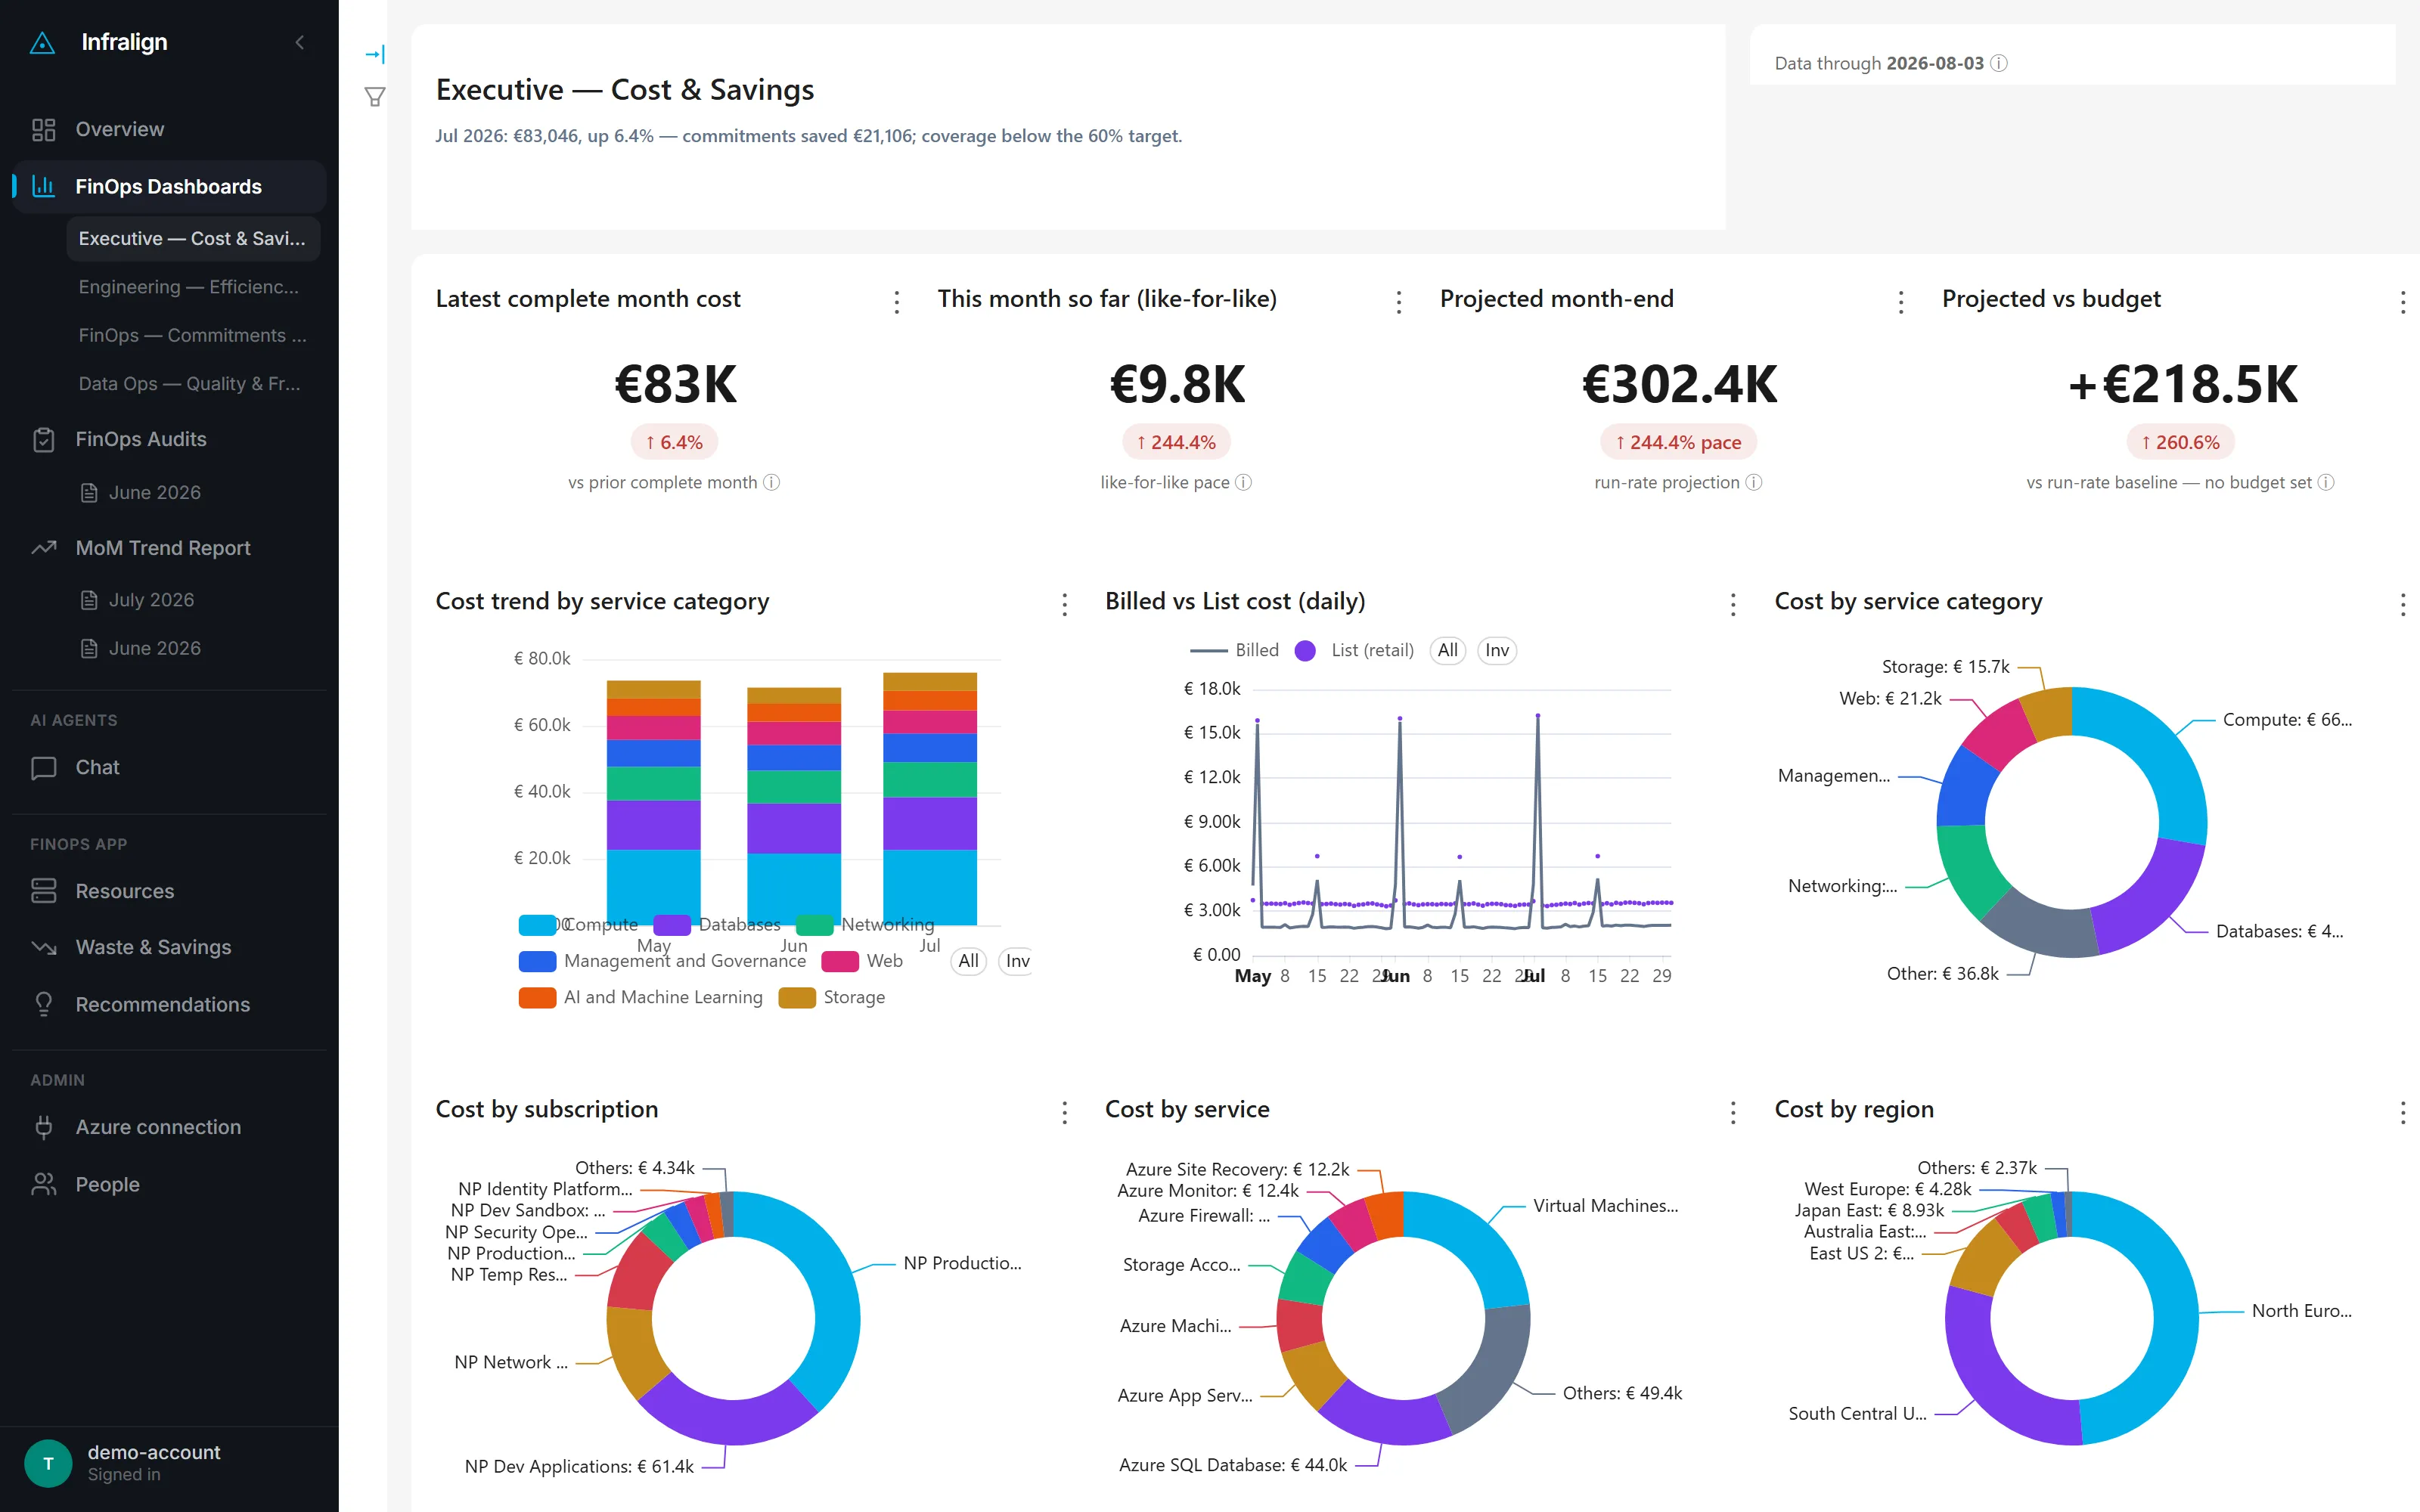
The Executive dashboard on the NovaPulse demo estate, captured 4 August 2026. Yours opens with your own figures and a cost trend already backfilled.
Check the engineering signals
Section titled “Check the engineering signals”- Open the Engineering dashboard.
- Review idle VMs, rightsizing candidates, and commitment coverage.
Done when you have noted any unexpected candidate or coverage value.
Check the chatbot
Section titled “Check the chatbot”- Open the chatbot.
- Ask a cost question, such as “What did SQL cost last month?”
Done when the response names the expected subscription, service, or period.
Troubleshooting
Section titled “Troubleshooting”| Symptom | Cause | Fix |
|---|---|---|
| A subscription has no billed total | Cost Management Reader is missing on that subscription | Assign the role. Wait for the next nightly run. |
| Cost appears but inventory or CPU is empty | Reader is missing on that subscription | Assign the role, then select Re-check the connection on the connection page. |
| A subscription you expected is not on any dashboard | It was excluded at the Scope step, it was created after setup, or the application Infralign reads as has no Reader role on it | Tick it on the connection page and save. If it is not listed, select Re-check the connection to run discovery again, then tick it. If it still does not appear, assign the two roles and re-check. |
| A dashboard shows STALE | A source missed its expected landing time | Check the Data Ops dashboard for the affected source. |
What happens next
Section titled “What happens next”The visibility tier remains available. The audit then follows this typical timeline:
| Time | Outcome |
|---|---|
| Week 1 | An architect sizes candidate findings, leads the working session, and finalises the report. |
| Week 2 | Your team reviews change plans for the highest-impact findings. |
| Weeks 3–4 | Your team merges approved changes, and Infralign verifies savings against billing data. |
Read what the audit covers before booking. See reading your audit report for the six decision fields.
Next: How your data flows.