

Free visibility
Dashboards
Every cost lane carries four dashboards, one for each audience that has to read the same numbers differently.
Dashboards are part of the visibility tier. They run on a dedicated Apache Superset instance embedded in the app, so you install nothing and need no separate BI login.
Once your first nightly run has landed, your dashboards open within one business day. See your first day.
Click any image to enlarge.
The four persona dashboards
Section titled “The four persona dashboards”Each cost lane carries four dashboards, one per audience.
| Dashboard | Use it to |
|---|---|
| Executive — Cost & Savings | Reconcile billed spend, track budget position, and identify the largest movements. |
| FinOps — Commitments & Savings | Compare commitment coverage with target and review realised savings before buying more. |
| Engineering — Efficiency & Resources | Review idle VMs, rightsizing candidates, licensing opportunities, anomalies, and resource-level spend. |
| Data Ops — Quality & Freshness | Check when each source landed and investigate data-quality flags. |
All four share the layout below: a one-line read of the month, a row of KPI tiles, then the charts behind them.
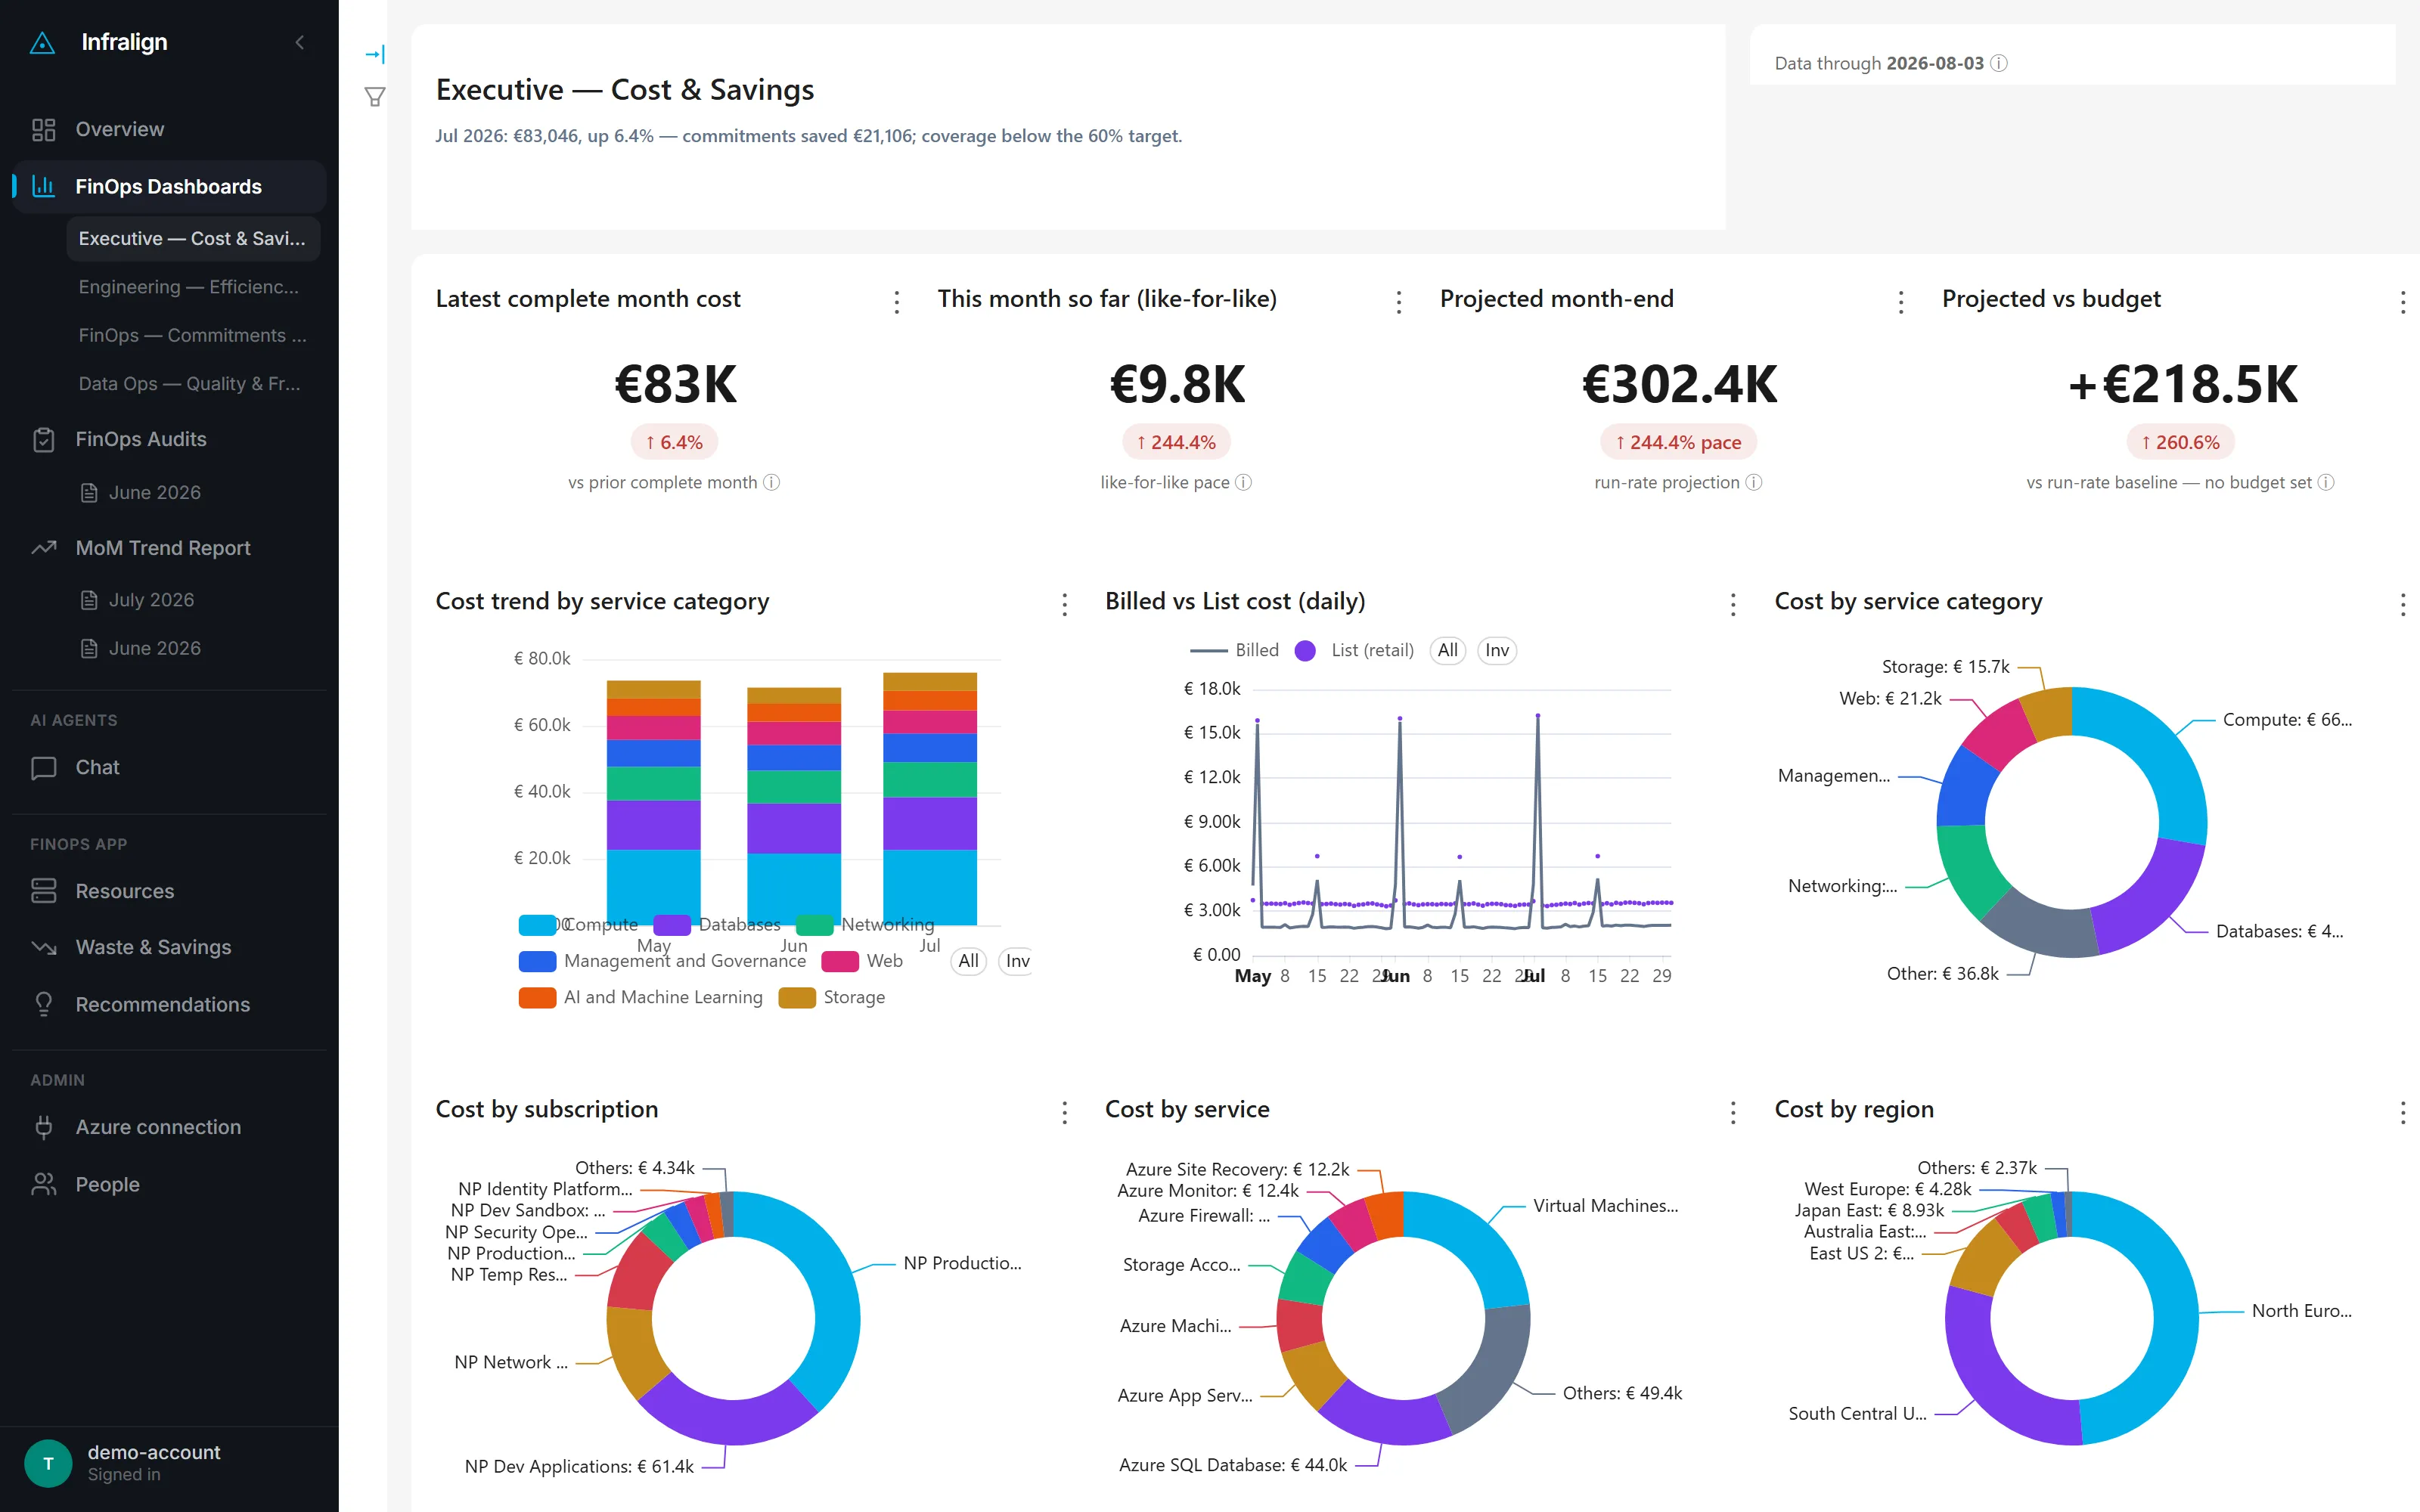
NovaPulse is a real Azure estate with its identifiers replaced, and these figures are unedited. Captured 4 August 2026, three days into the month, which is why the two projection tiles extrapolate so far above the completed one.
Reading the freshness banner
Section titled “Reading the freshness banner”Every dashboard carries an as-of line. Cost, utilisation, and inventory have separate dates because their sources land at different times.
Read the date beside a figure before using it.

| Lane or state | Expected freshness | Action |
|---|---|---|
| Cost API | About one day behind | Investigate when the date is more than two days behind. |
| FOCUS | Up to one month behind | No action; the lane runs monthly. |
| STALE | Outside the source’s expected window | Check the source on the Data Ops dashboard. |
The Data Ops dashboard is where that last row is answered. Its source-freshness table gives one row per feed, with the date that feed has data through and how far behind it is.
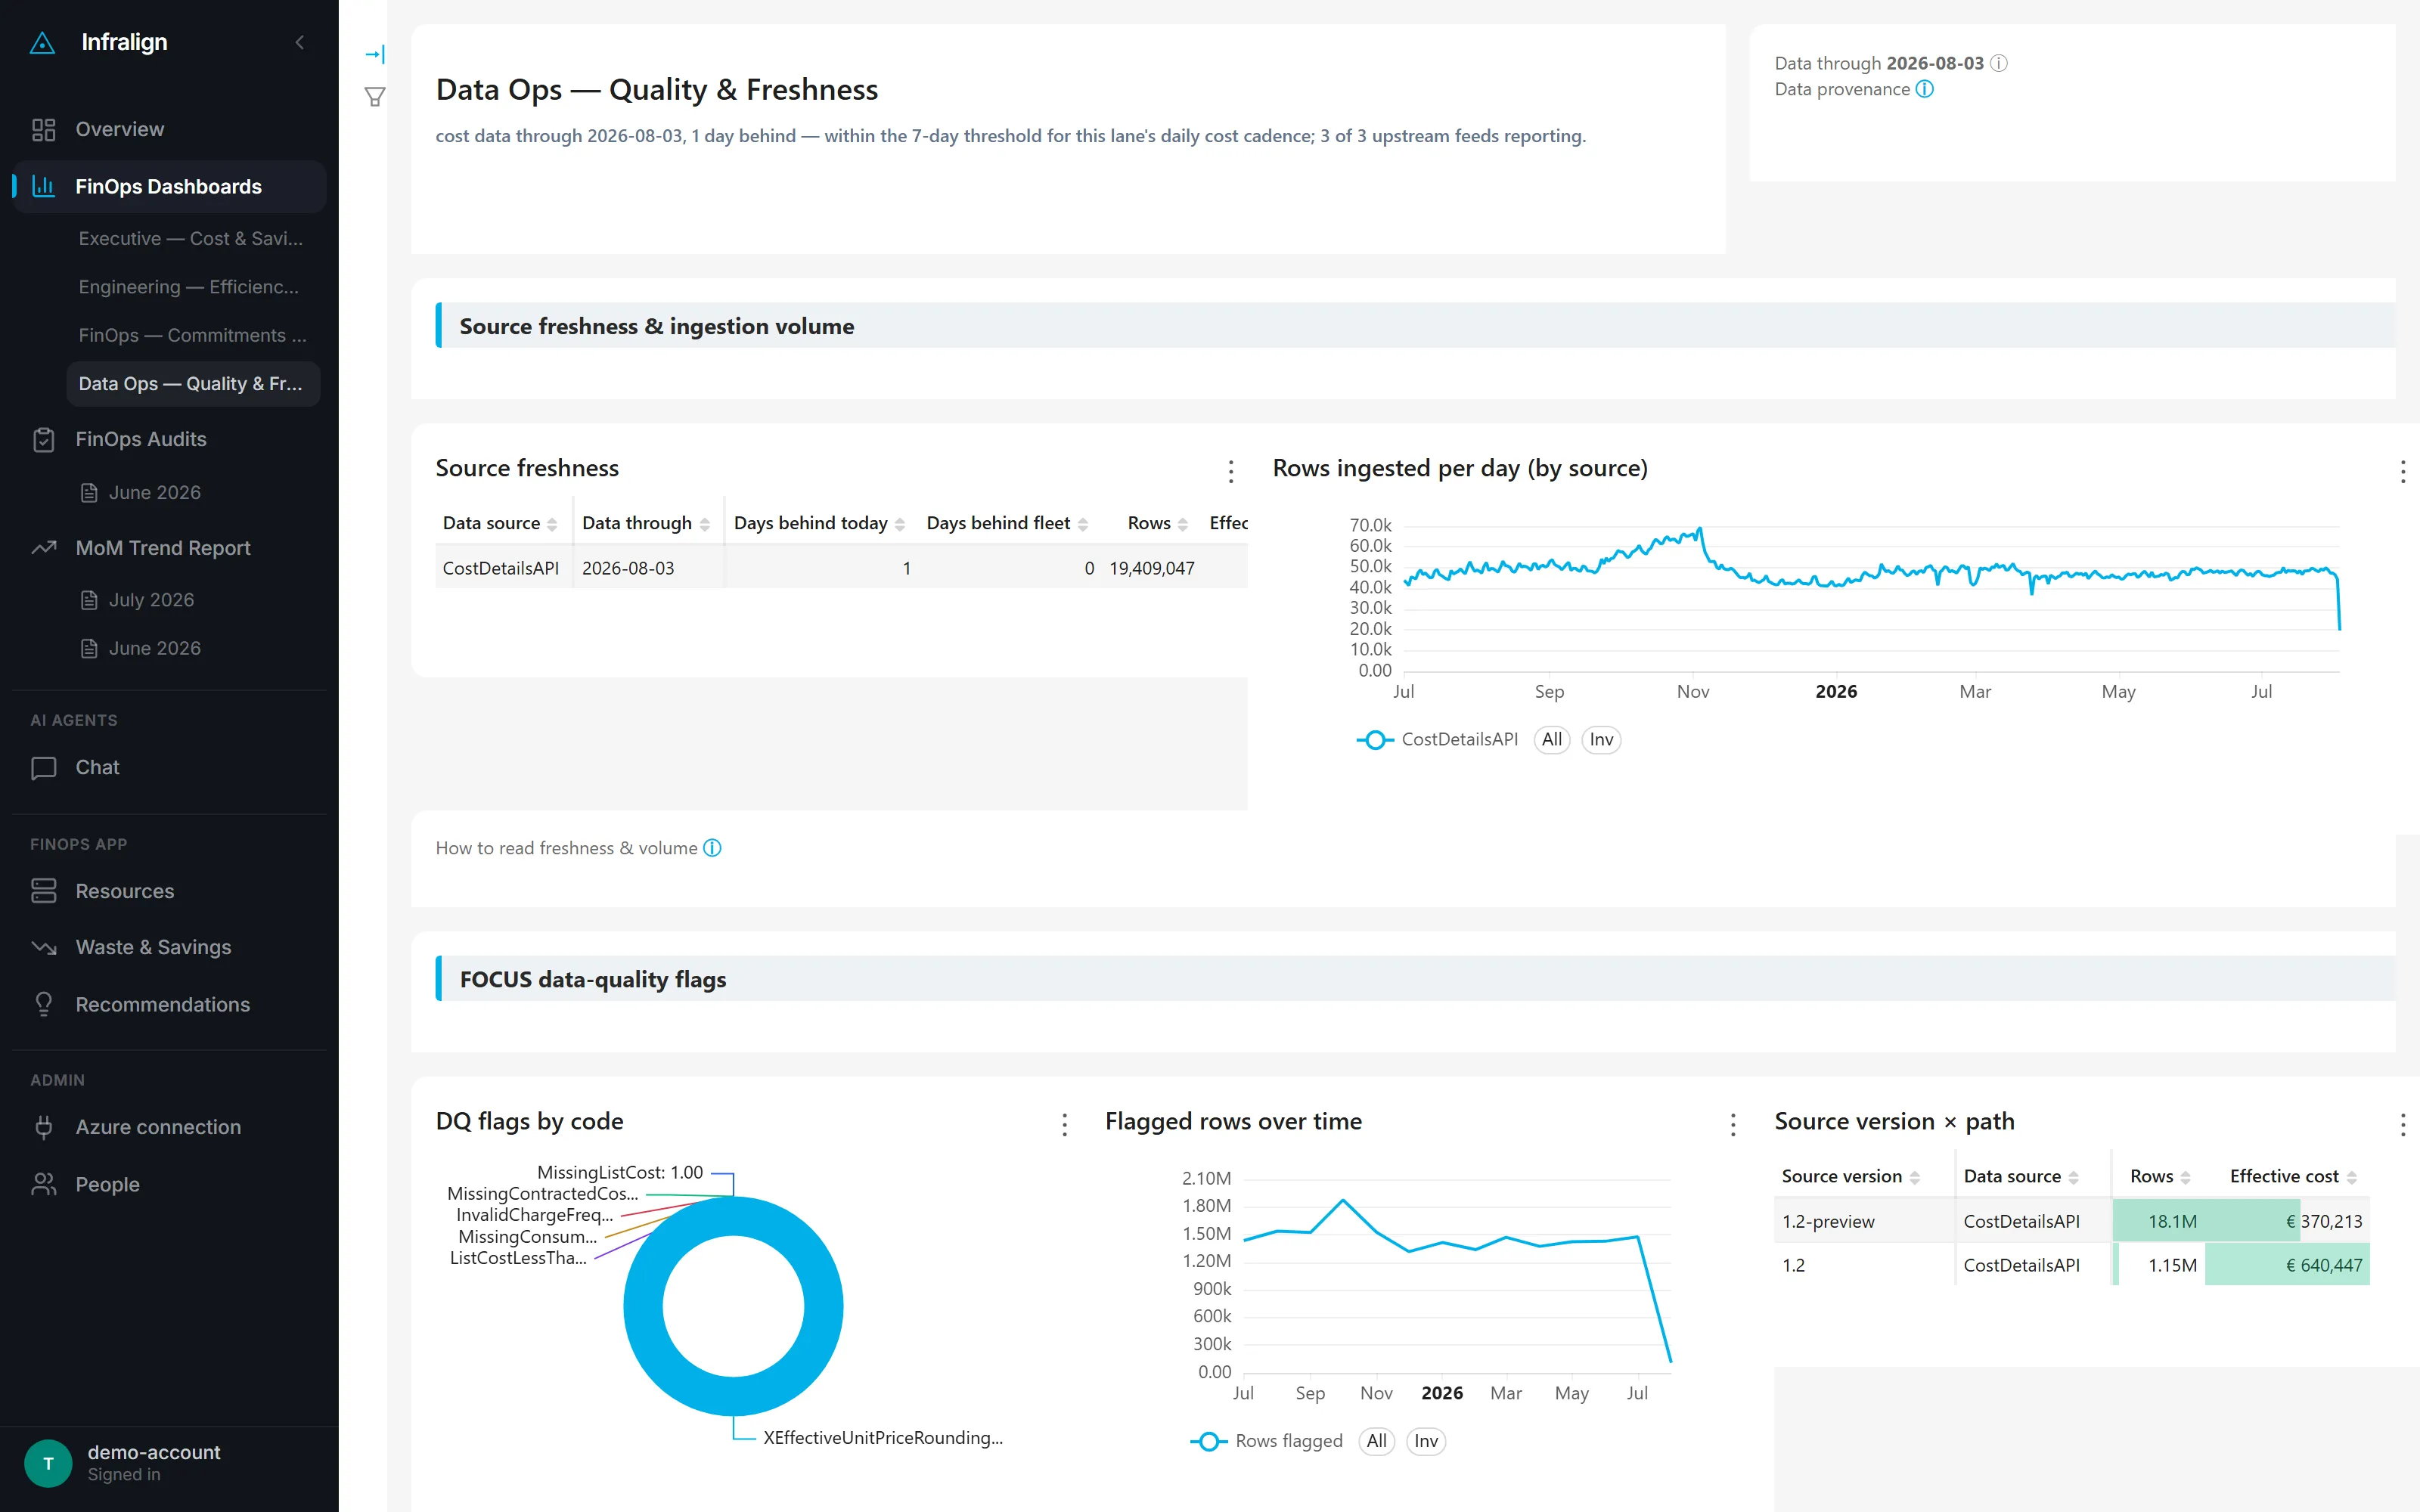
Same estate, same capture date.
Cost terms
Section titled “Cost terms”Quoting the wrong term is the commonest reconciliation error. Cost terms in the glossary defines each one.
- Quote billed (actual) cost when reconciling against the Azure invoice.
- Quote effective (amortised) cost, the dashboard default, when steering decisions.
- Quote coverage % per commitment pool only. Savings Plans and Reservations use different denominators, so never average them.
Savings tiles
Section titled “Savings tiles”Realised savings and indicative savings both appear on the dashboards, and they are measured against different baselines.
| Tile | What it measures | Baseline |
|---|---|---|
| Realised commitment savings | What your reservations and savings plans have already saved, banked. | Pay-as-you-go |
| Indicative savings | The saving a finding would deliver if approved. | Retail (pay-as-you-go) price |
Do not add the two values. Their different baselines make the total double-count savings.
Some tiles ignore the date filter because they describe a fixed period or current state:
- projected versus budget
- realised and indicative savings
- coverage
- cost by country
The cost lanes
Section titled “The cost lanes”| Lane | Cadence | Use it for |
|---|---|---|
| Cost API | Daily | The freshest movements and the default four dashboards. |
| FOCUS 1.2 | Monthly | A standardised, portable dataset for estates that outgrow the nightly window. |
The Cost API lane merges Actual and Amortized metrics. When you need FOCUS, follow FOCUS exports and storage setup.
Refresh and filters
Section titled “Refresh and filters”The nightly run syncs the dashboards before the working day. You do not need to refresh them manually.
See data sources for stage times and the 13-month backfill.
| Filter | Available scope |
|---|---|
| Subscription | One subscription or the whole estate |
| Service | Azure service or service category |
| Region | Country or region |
| Charge period | Month or date range |
Exporting numbers
Section titled “Exporting numbers”Download a tile’s CSV from the BI view. During an engagement, request monthly report figures as a spreadsheet.
A self-serve export API is on the roadmap and is not available today.