

Free visibility
Reports
Once a month an Azure FinOps expert writes up what the estate cost and what moved.
Each month an Azure FinOps expert writes up what your Azure estate cost, what moved, and what needs a decision. The report lands on the app’s Audits page as HTML you can read on screen or forward without editing. It is built on the same data as your dashboards, so the two reconcile.
What the monthly report contains
Section titled “What the monthly report contains”It opens on the spend summary and works down to the findings.
| Section | What it carries |
|---|---|
| Spend summary | Totals for the month against the prior month, by subscription and service, in your billing currency. |
| Month-on-month cause analysis | The cost lines that moved most, with the resource-level detail behind each movement. |
| Commitment position | Reservation and Savings Plan coverage against target, including gaps that need review. |
| Savings opportunities | Findings surfaced from the estate: idle VMs, rightsizing candidates, orphaned disks, and more. Each carries the six decision fields; the full detection list is in what the audit covers. |
Where a signal is missing, the report says so on its own front page. Silence would read as a clean estate.
The month-on-month section opens on the movement itself: the resources that pushed spend up, the resources that pulled it down, and the gross figures the net number hides.
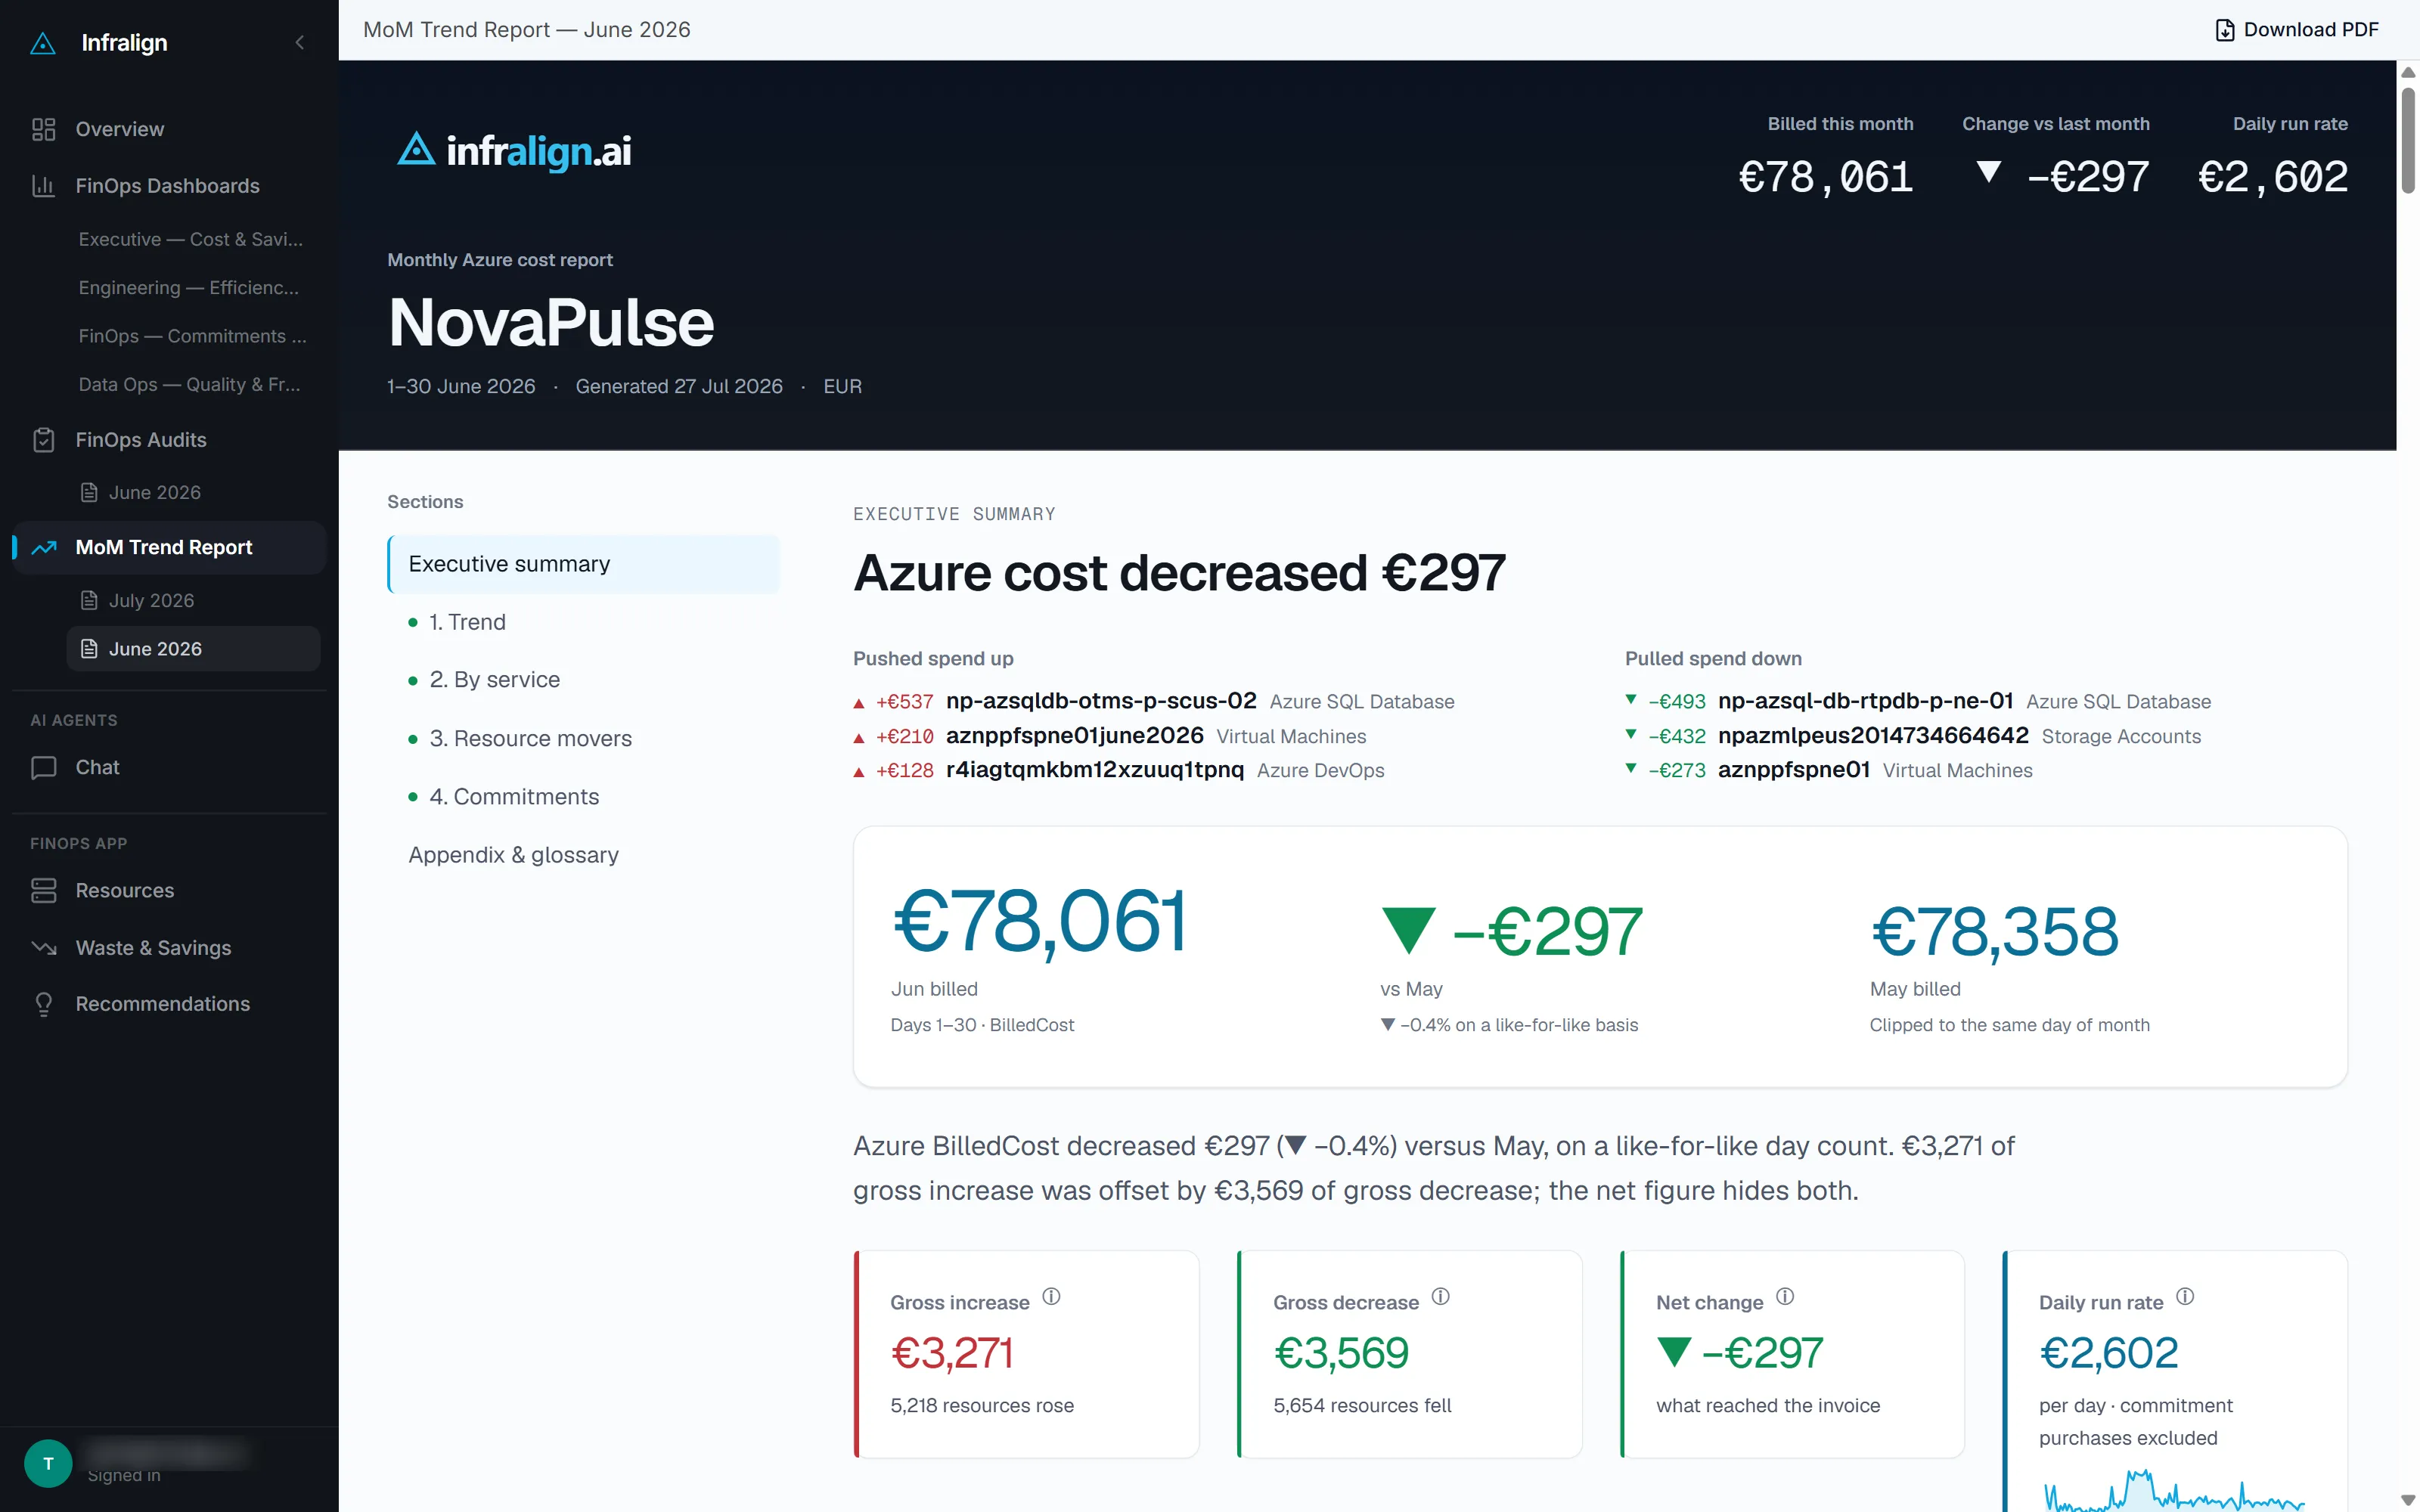
Real spend from NovaPulse, a real Azure estate with its identifiers replaced. The movements above are as the report found them.
Reconciling to your Azure invoice
Section titled “Reconciling to your Azure invoice”Your Azure invoice is a billed number. Match it to the dashboard’s Billed series: the billed-by-month tile on the Executive dashboard, or the Billed cost column in the resource-level detail. The headline effective (amortised) figure spreads commitment purchases across time and will not match line-for-line.
Expect small gaps: amortisation, credits, tax, and marketplace charges each move the two apart. If it will not tie out, raise it in the working session.
Who reports are written for
Section titled “Who reports are written for”A report has to survive two readers: the platform engineer who owns the resources, and the finance owner who sees the invoice.
- Numbers are in your billing currency, with K/M abbreviations (euros in NovaPulse above).
- Movements name the specific resources responsible.
Working with reports
Section titled “Working with reports”- Reconcile the report’s Billed series against your invoice once, early (see reconciling to your Azure invoice). After that, trust the nightly run.
- Review the month-on-month cause analysis each month; anything unexplained is a question for the chatbot before it becomes a budget conversation.
- Note the findings you’d prioritise. The audit session starts faster when your team arrives with a view.
Monthly report figures can be provided as a spreadsheet on request during an engagement. Chart-level CSV export is in the dashboards BI view.
The monthly report continues for as long as your Azure connection stands, whether or not you proceed to an engagement.